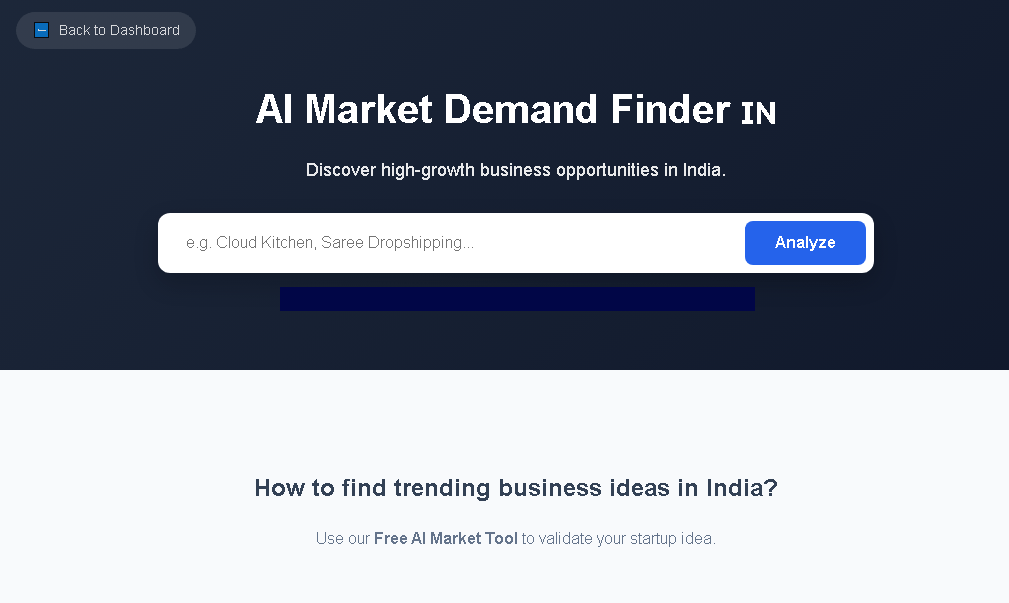
India’s rapidly expanding economy, a youthful population of over 1.4 billion, and a government that actively promotes foreign investment make it a magnet for international businesses. However, entering the Indian market without a deep, data‑driven understanding can lead to costly missteps. Robust market research equips foreign firms with the insights needed to navigate complex regulatory frameworks, diverse consumer preferences, and regional variations that are unique to India.
By systematically gathering and analysing Indian market data, companies can:
In short, market research is the strategic compass that transforms the uncertainty of “going global” into a calculated, profitable expansion.
Operating across India’s 28 states and 8 union territories presents a set of challenges that differ markedly from those in Western or other Asian markets. Below is a concise overview of the most critical hurdles.
| Challenge | Impact on International Business | Why a Tailored Approach Is Crucial |
|---|---|---|
| Regulatory Diversity | Varying state‑level FDI caps, land‑acquisition rules, and licensing requirements. | One‑size‑fits‑all compliance strategies can cause delays or legal penalties. |
| Infrastructure Gaps | Logistics bottlenecks in tier‑2 and tier‑3 cities; inconsistent power supply. | Supply‑chain planning must account for regional disparities. |
| Cultural & Linguistic Fragmentation | 12 official languages; distinct regional festivals influencing demand cycles. | Marketing messages need localisation to resonate with local audiences. |
| Price Sensitivity | Average per‑capita income varies from Rs 1.2 lakh in metros to Rs 60,000 in rural areas. | Pricing models must be calibrated for each segment to avoid alienating consumers. |
| Digital Adoption Gaps | While urban internet penetration exceeds 70 %, rural penetration is below 30 %. | Omni‑channel strategies must blend offline and online touchpoints. |
| Talent Acquisition & Retention | Skilled labour scarcity in emerging tech hubs outside Bengaluru and Hyderabad. | HR policies must align with local labour laws and cultural expectations. |
Choosing the right research methodology determines the reliability of insights. The table below maps recommended approaches to specific research objectives, highlighting best practices for the Indian context.
| Methodology | When to Use It | Best Practices for India |
|---|---|---|
| Quantitative Surveys (Online & Mobile) | Assess broad consumer preferences, price elasticity, and brand awareness. | Leverage regional language questionnaires; partner with local panel providers to ensure representation across states. |
| Qualitative Focus Groups | Explore cultural nuances, product‑fit, and emotional triggers. | Conduct sessions in tier‑1 cities for urban insights and tier‑2 cities for emerging market perspectives. |
| Secondary Data Analysis | Benchmark against industry reports, government statistics, and trade data. | Utilise sources like Ministry of Commerce & Industry, RBI publications, and industry associations such as CII. |
| Competitive Intelligence Mapping | Identify local rivals, joint‑venture opportunities, and market gaps. | Track Indian startups through platforms like YourStory and Crunchbase India. |
| Ethnographic Field Studies | Observe real‑world buying behaviour in markets, bazaars, and e‑commerce touchpoints. | Deploy local researchers fluent in regional dialects to capture authentic insights. |
| AI‑Driven Predictive Analytics | Forecast demand, optimise pricing, and simulate entry scenarios. | Adopt tools that can process Indian‑specific data sets, such as transaction logs from Paytm or phone usage stats from Jio. |
Access to reliable data and analytical platforms is essential for turning raw information into actionable strategy. Below is a curated list of indispensable resources, including the recommended AI‑powered solution.
| Resource / Tool | Type | Key Benefits for International Business | Cost (Indicative, INR) |
|---|---|---|---|
| BizplanAI Pro – Market Check | AI‑Driven Market Intelligence Platform | Real‑time analysis of Indian market trends, competitor profiling, and demand forecasting; integrates local GST, FDI, and labour law data. | Starts at Rs 299 / pay‑as‑you‑go |
| Ministry of Statistics & Programme Implementation (MOSPI) | Government Database | Official macro‑economic indicators, CPI, and demographic breakdowns. | Free |
| Reserve Bank of India (RBI) Reports | Regulatory Publications | Insights on foreign exchange flows, FDI approvals, and banking sector health. | Free |
| Statista India | Commercial Market Data | Industry‑specific revenue forecasts, consumer spending patterns, and market size. | Rs 12,000 / year (approx.) |
| CRISIL Research | Credit Rating & Industry Analysis | Sectoral risk assessments, competitive landscape, and investment outlooks. | Rs 8,000 / report |
| India Brand Equity Foundation (IBEF) | Industry Association | Sector‑wise export data, policy updates, and case studies. | Free |
| Trade Map (International Trade Centre) | Trade Statistics | Import‑export flows by product HS code, useful for supply‑chain planning. | Free (basic) / Rs 2,500 / year (premium) |
Following a structured process ensures that research outputs are both comprehensive and actionable. Below is a step‑by‑step guide tailored for foreign firms targeting the Indian market.
Identify the most promising consumer or B2B groups using demographic, psychographic, and behavioural criteria. The table below illustrates typical Indian segments for international businesses.
| Segment | Key Characteristics | Preferred Channels |
|---|---|---|
| Urban Millennials (25‑35) | High digital adoption, brand‑conscious, disposable income Rs 30‑50 k/month. | Instagram, YouTube, e‑commerce platforms (Flipkart, Amazon). |
| Tier‑2 Small & Medium Enterprises | Growth‑oriented, price‑sensitive, seeking technology upgrades. | LinkedIn, industry expos, regional trade fairs. |
| Rural Homemakers | Value‑driven, influenced by local festivals, limited internet access. | Radio, regional TV, local retail stores. |
Refer to the “Key Methodologies & Approaches” table to select a mix of quantitative, qualitative, and AI‑driven techniques that suit each segment.
Track performance against predefined KPIs (see table below).
| Metric | Definition | Target for First 12 Months |
|---|---|---|
| Market Share | Percentage of total sales in target segment. | 5 % |
| Customer Acquisition Cost (CAC) | Total marketing spend ÷ number of new customers. | Rs 1,200 |
| Net Promoter Score (NPS) | Measure of customer loyalty and advocacy. | +30 |
| Regulatory Compliance Rate | Percentage of required licences and filings completed on time. | 100 % |
Review quarterly performance, refresh data sets, and adjust tactics based on emerging trends such as new GST slabs or changes in FDI policy.
It provides data‑driven insights on regulations, consumer behavior, and competition, reducing risks and guiding strategic decisions.
Complex tax structures, sector‑specific licensing, and state‑level compliance requirements that vary across regions.
A youthful population of over 1.4 billion offers a large, tech‑savvy consumer base with growing purchasing power.
Digital services, renewable energy, pharmaceuticals, and consumer goods are experiencing rapid expansion.
Combining primary surveys, focus groups, and secondary data from government and industry reports yields comprehensive insights.