India’s consumer landscape is evolving at a break‑neck speed. With a population exceeding 1.4 billion, a growing middle class, and a digital penetration rate that crossed 45 % in 2023, the opportunity pool for new product launches is massive. However, the same diversity that fuels growth also creates complexity. Regional preferences, price sensitivity, regulatory nuances, and cultural festivals can make or break a launch. Conducting thorough market research before introducing a product is therefore not a luxury—it is a strategic imperative that safeguards investment, aligns the offering with local expectations, and accelerates time‑to‑market.
| Challenge | Impact on Launch | Mitigation Strategy |
|---|---|---|
| Regional Price Sensitivity | Price points acceptable in metros may be prohibitive in Tier‑2/3 cities. | Segment pricing based on purchasing power parity; use localized promotions. |
| Regulatory Hurdles | Complex approvals for categories like food, cosmetics, and electronics. | Engage a compliance consultant early; track updates from FSSAI, BIS, and DGFT. |
| Cultural Diversity | Product positioning that works in the north may clash with southern traditions. | Conduct ethnographic studies; tailor messaging for linguistic and cultural nuances. |
| Distribution Fragmentation | India’s retail mix includes modern trade, kirana stores, and e‑commerce. | Design a multichannel go‑to‑market (GTM) plan that leverages each channel’s strengths. |
| Digital Literacy Gaps | Online adoption varies widely across age groups and regions. | Combine digital campaigns with offline activations; use WhatsApp for direct engagement. |
| Segment | Key Demographics | Preferred Buying Channels | Typical Price Sensitivity |
|---|---|---|---|
| Urban Young Professionals (25‑35) | College‑educated, dual‑income, metro residents. | E‑commerce, premium retail. | Medium‑high; value convenience and brand prestige. |
| Tier‑2/3 Family Shoppers (30‑45) | Middle‑income, family‑oriented, small towns. | Kirana stores, local supermarkets. | High; price‑first decision making. |
| Rural Aspirants (18‑30) | Agricultural or informal sector workers, aspirational. | Village fairs, mobile vans, regional e‑commerce. | Very high; discount‑driven. |
| Senior Citizens (60+) | Pensioners, health‑conscious. | Pharmacies, community stores. | Medium; brand trust matters. |
| Methodology | Description | Best‑Practice Tips for India |
|---|---|---|
| Voice‑of‑Customer (VoC) Interviews | In‑depth conversations with target users to capture unmet needs. | Use regional languages; record insights on mobile devices for rapid analysis. |
| Conjoint Analysis | Quantitative technique to gauge trade‑offs between price, features, and brand. | Include locally relevant attributes like “festival packaging” or “cash‑on‑delivery”. |
| Test‑Market Pilots | Small‑scale product roll‑out in select cities or districts. | Choose a mix of metros and Tier‑2 cities; monitor sales via POS data. |
| Social Listening & Sentiment Mining | Analyzing social media chatter to detect early adoption signals. | Leverage platforms popular in India—WhatsApp, Instagram, and regional forums. |
| AI‑Powered Trend Forecasting | Machine‑learning models that predict emerging consumer trends. | Adopt tools like BizplanAI pro for real‑time Indian market intelligence. |
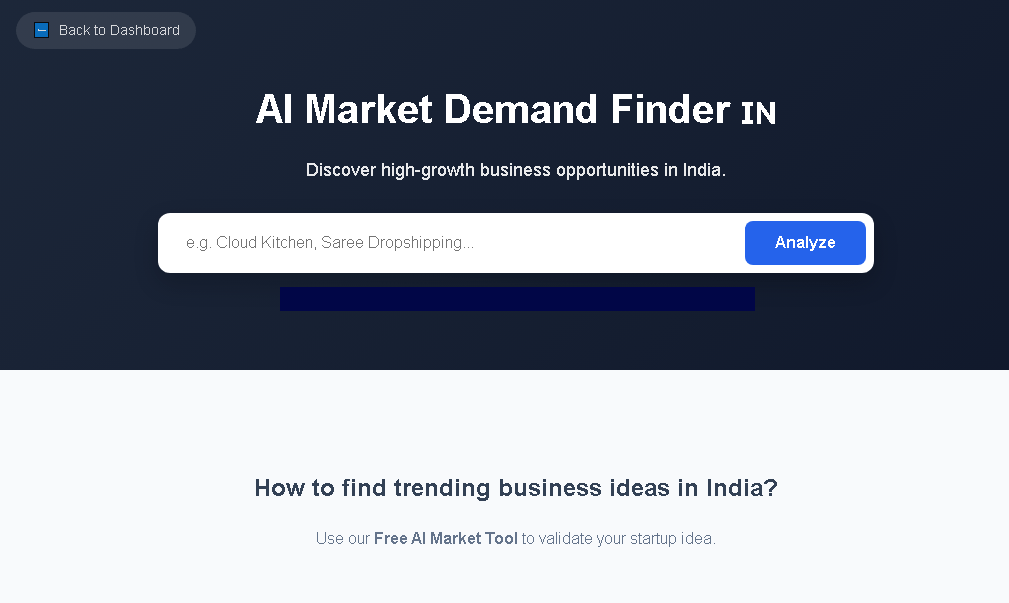
Among these, AI‑Powered Trend Forecasting stands out as a game‑changer for Indian brands. BizplanAI pro offers a pay‑as‑you‑go plan starting at just Rs 299, delivering granular insights on regional demand spikes, competitor moves, and pricing elasticity. By integrating its analytics into your product development cycle, you can iterate faster and allocate marketing spend where it yields the highest ROI.
| Trend / Competitor | Impact on New Product Strategy | Actionable Response |
|---|---|---|
| Rise of “Super‑App” Ecosystems (e.g., Paytm, PhonePe) | Consumers expect seamless in‑app purchases and loyalty integration. | Partner with super‑apps for bundled offers and instant checkout. |
| Health‑Centric Consumer Shift | Demand for organic, low‑sugar, and Ayurvedic variants is soaring. | Introduce clean‑label extensions; certify with FSSAI organic tags. |
| Local Brands Leveraging “Make in India” Narrative | Patriotic buying drives preference for domestically produced goods. | Highlight Indian sourcing and CSR initiatives in marketing. |
| Fast‑Fashion Retailers (e.g., Myntra, Ajio) Expanding Private Labels | Private labels capture up to 30 % of category sales in fashion. | Differentiate through exclusive designs or limited‑edition drops. |
| Emergence of Subscription‑Based Models (e.g., BigBasket’s “Bazzar”) | Consumers appreciate convenience and predictable pricing. | Offer subscription packs for consumables; use AI to predict reorder cycles. |
| Resource / Tool | Key Features for Indian Market | Access / Cost |
|---|---|---|
| BizplanAI pro | AI‑driven competitor mapping, price elasticity models, regional trend dashboards. | Pay‑as‑you‑go from Rs 299 per analysis; subscription discounts available. |
| CMIE Prowess | Macro‑economic indicators, consumer expenditure surveys, state‑wise CPI. | Annual licence; corporate pricing on request. |
| Statista India | Industry reports on e‑commerce growth, FMCG turnover, and digital adoption. | Free tier with limited reports; premium from $199 / month. |
| Google Trends (India) | Real‑time search interest by city; seasonal spikes around festivals. | Free. |
| Retail Pulse (NielsenIQ) | POS‑level sales data across modern trade and kirana networks. | Custom quotes; often bundled with consulting. |
| Social Listening Platforms (Brandwatch, Sprinklr) | Multilingual sentiment analysis for Hindi, Tamil, Bengali, etc. | Tiered pricing; starter plans from $99 / month. |
| Metric | Definition | Target Benchmark (India) |
|---|---|---|
| Market Penetration Rate | Percentage of target households that purchased within 3 months. | ≥ 12 % for FMCG; ≥ 5 % for durable goods. |
| First‑Month Revenue | Total sales value in INR for the launch month. | Rs 5 crore for midsize consumer brands; Rs 20 crore for tech gadgets. |
| Customer Acquisition Cost (CAC) | Average spend to acquire one paying customer. | Rs 150‑Rs 300 for mass‑market; Rs 800‑Rs 1,200 for premium. |
| Repeat Purchase Rate (RPR) | Share of customers buying again within 60 days. | ≥ 30 % for consumables; ≥ 15 % for apparel. |
| Net Promoter Score (NPS) | Customer loyalty indicator ranging from –100 to +100. | +30 or higher for a successful launch. |
For a confidence level of 95 % and a margin of error of ±5 %, a minimum of 385 respondents is statistically sufficient for a homogeneous segment. However, because India is highly heterogeneous, aim for 500‑1,000 respondents per major segment (metro, Tier‑2, rural) to capture regional variance.
Use a combination of conjoint analysis and AI‑driven price elasticity modeling (e.g., BizplanAI pro). Map the resulting price curves against state‑wise per‑capita income data from CMIE. This allows you to set tiered price points—premium in metros, value‑oriented in Tier‑2/3 towns, and micro‑pricing for rural markets.
Most product categories—such as food, cosmetics, and electronics—require central approvals (FSSAI, BIS, DGFT). However, certain states impose additional labeling or packaging norms (e.g., Karnataka’s “Karnataka Brand” badge for locally manufactured goods). It is advisable to consult a local compliance expert to avoid state‑level roadblocks.
No. While social listening provides real‑time sentiment and identifies trending topics, it often skews toward digitally active users. Traditional focus groups still uncover deep motivations, especially among older or less‑connected demographics. A hybrid approach yields the most comprehensive insight.
BizplanAI pro processes publicly available datasets, competitor filings, and consumer behavior signals in near real‑time. For a standard market‑check report, you can expect a turnaround of 2‑4 hours, allowing you to iterate product concepts within a single business day.
Festivals drive up discretionary spending by 30‑40 % in many categories. Aligning product introductions with Diwali, Dussehra, Eid, or regional celebrations (e.g., Pongal in Tamil Nadu) can amplify visibility and accelerate adoption. Ensure promotional offers respect cultural sensitivities (e.g., avoid meat‑based imagery during Hindu festivals).
Yes. A digital‑first pilot reduces inventory risk and offers granular sales analytics. However, for categories where tactile experience matters (e.g., apparel, cosmetics), complement online testing with pop‑up stores or experiential kiosks in high‑traffic malls.
Integrate POS data, e‑commerce dashboards, and social sentiment into a single KPI dashboard. Track the success metrics listed in the “Launching new products_success_metrics” table daily. Set automated alerts when any metric deviates beyond a 10 % threshold from the target.
A common rule of thumb for Indian launches is a 30‑40 % allocation to market research and validation, 30 % to product development (including packaging and compliance), and 30‑40 % to promotion. Adjust these ratios based on product complexity and competitive intensity.
India’s diverse consumer base, regional preferences, and price sensitivity mean that without deep market insights, a product may miss target segments, face regulatory hurdles, or fail to resonate culturally.
Demographic profiles, regional buying habits, price elasticity, digital usage patterns, competitor landscape, and local regulatory requirements.
Festivals like Diwali, Eid, and Pongal drive peak spending; aligning launches with these periods can boost visibility and sales, while missing them may reduce market traction.
With over 45% digital penetration, online channels, mobile commerce, and social media influence are critical for reach, especially among the growing middle class and urban youth.
Conduct pilot launches in select cities or regions, use focus groups, gather feedback through surveys, and monitor online sentiment to refine positioning and pricing before scaling.