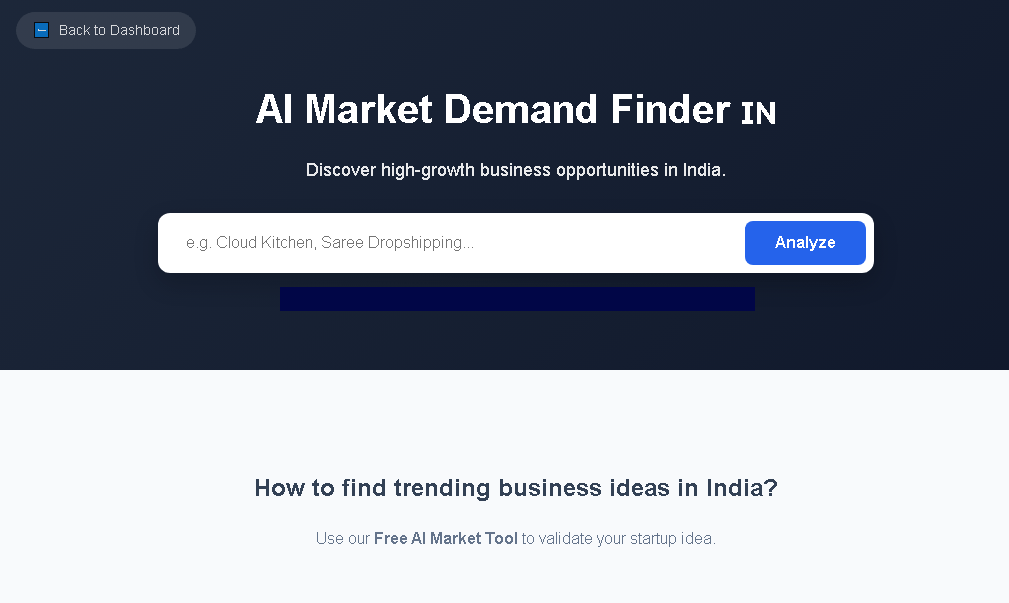
In the rapidly evolving Indian economy, where the consumer base exceeds 1.4 billion and digital adoption is soaring, conducting rigorous market research is no longer optional—it is a strategic imperative for any business aiming to thrive. Market research equips businesses with data‑driven insights that guide product development, pricing strategies, distribution channel selection, and branding decisions. By understanding regional preferences, regulatory nuances, and competitive dynamics, Indian businesses can mitigate risk, allocate resources efficiently, and capture growth opportunities that align with the country’s unique cultural and economic landscape.
From the bustling metros of Mumbai and Bengaluru to tier‑2 and tier‑3 cities such as Jaipur and Visakhapatnam, consumer behavior varies dramatically. A well‑structured research framework helps businesses decode these variations, ensuring that offerings resonate with local tastes while complying with Indian regulations like the GST Act, FDI policies, and sector‑specific licensing requirements. Moreover, leveraging AI‑powered platforms such as BizplanAI pro—which starts at just Rs. 299 per analysis—can accelerate data collection and provide actionable trend forecasts, giving Indian businesses a decisive edge.
| Challenge | Impact on Research | Mitigation Strategy |
|---|---|---|
| Diverse Linguistic Landscape | Survey instruments must be multilingual to avoid response bias. | Deploy language‑specific questionnaires; use local field partners. |
| Regulatory Complexity | Compliance requirements differ across states (e.g., labor laws, pricing caps). | Map regulatory frameworks early; consult legal counsel for data collection. |
| Fragmented Retail Channels | Traditional kirana stores coexist with e‑commerce giants, complicating channel analysis. | Adopt omnichannel tracking tools; segment data by offline vs. online sales. |
| Variable Internet Penetration | Rural areas may have limited online survey reach. | Combine digital panels with face‑to‑face interviews in low‑connectivity zones. |
| Price Sensitivity | Indian consumers often prioritize value, influencing willingness‑to‑pay studies. | Integrate conjoint analysis with local purchasing power metrics. |
Standardized global research templates fail to capture the nuances of Indian consumer psyche—such as the importance of festivals, family decision‑making, and regional brand loyalties. A tailored approach that incorporates cultural festivals (Diwali, Eid, Pongal), local purchasing rituals, and state‑specific tax structures ensures that insights are both relevant and actionable. Moreover, the rise of regional e‑commerce platforms like JioMart and Snapdeal demands a granular view of digital adoption patterns across different income brackets.
| Methodology | Relevance to Indian Market | Best Practice Tips |
|---|---|---|
| Quantitative Surveys (Online & Offline) | Captures large‑scale preferences across diverse demographics. | Use stratified sampling by state, language, and income; validate with pilot tests. |
| Qualitative Focus Groups | Uncovers deep cultural motivations and brand perceptions. | Facilitate sessions in local languages; include mixed‑age groups to reflect family buying cycles. |
| Conjoint Analysis | Determines optimal product features and price points for price‑sensitive segments. | Incorporate region‑specific attributes like “local flavor” or “Ayurvedic certification.” |
| Social Listening & Sentiment Mining | Leverages high mobile usage to monitor real‑time consumer chatter on platforms like WhatsApp, Instagram, and regional forums. | Deploy AI tools (e.g., BizplanAI pro) to filter language‑specific sentiment. |
| Ethnographic Field Studies | Observes purchasing behavior in natural settings such as street markets and kirana stores. | Partner with local research agencies for authentic immersion. |
For a holistic view, combine quantitative breadth with qualitative depth. Begin with a large‑scale survey to identify macro trends, then drill down using focus groups and ethnography to validate hypotheses. Integrate AI‑driven analytics from platforms like BizplanAI pro to process unstructured data (social media posts, reviews) and generate predictive models that forecast demand spikes around major festivals or policy changes.
| Resource / Tool | Type | Key Features for Indian Business Research |
|---|---|---|
| BizplanAI pro | AI‑Powered Market Intelligence Platform | Real‑time Indian market trend analysis, competitor benchmarking, price sensitivity modeling; starts at Rs. 299 per use. |
| CMIE Prowess | Database | Financial statements of Indian companies, sector‑wise growth rates, GST compliance data. |
| Statista India | Research Portal | Macro‑economic indicators, consumer spending patterns, e‑commerce penetration stats. |
| Google Trends (India) | Free Tool | Search volume insights for product categories, seasonal spikes, regional interest heatmaps. |
| IndiaStat | Statistical Repository | Census data, urban‑rural demographics, literacy rates, household income distribution. |
| Social Media Listening Platforms (e.g., Brandwatch, Sprinklr) | Analytics Suite | Multilingual sentiment tracking across WhatsApp, Instagram, regional forums. |
Identify distinct consumer groups based on geography, income, language, and purchase behavior.
| Segment | Key Demographics | Typical Buying Triggers |
|---|---|---|
| Urban Young Professionals (25‑35) | Mumbai, Bengaluru; INR 30‑60 k monthly income; English/Hindi | Tech‑savvy, brand prestige, convenience. |
| Tier‑2 Family Shoppers (30‑50) | Ahmedabad, Lucknow; INR 20‑40 k monthly income; Hindi/Regional language | Value for money, festival discounts, family endorsement. |
| Rural Aspirational Consumers | Villages in UP, Bihar; INR 5‑15 k monthly income; regional dialects | Affordability, local brand trust, government scheme subsidies. |
Combine quantitative surveys (online via mobile‑first platforms) with qualitative focus groups in regional hubs. Use conjoint analysis for pricing and feature testing, especially for FMCG and tech products.
Leverage agencies that have established networks with kirana stores, local influencers, and community leaders. Ensure compliance with data‑privacy laws such as the IT Act 2000 and upcoming Personal Data Protection Bill.
Upload raw data into BizplanAI pro to generate automated segmentation, trend forecasts, and competitor heatmaps. Complement AI output with manual cross‑checks for outlier validation.
Structure the final report around business success metrics such as projected market share, break‑even timeline, and customer lifetime value (CLV). Include a clear go‑to‑market (GTM) roadmap with timelines, budget allocations (in INR), and KPI dashboards.
Launch the product or campaign, track real‑time performance via CRM and sales analytics, and schedule quarterly research refreshes to adapt to evolving consumer trends.
Utilize mobile‑first surveys combined with local field agents who can conduct face‑to‑face interviews. Platforms like BizplanAI pro offer pay‑as‑you‑go pricing (starting at Rs. 299) for data processing, keeping overall costs low.
Given the fast‑changing regulatory environment and consumer preferences, a full research cycle is recommended annually, with quarterly mini‑studies focusing on seasonal trends (e.g., Diwali, monsoon sales).
Secondary data provides a macro view but lacks the granularity needed for product‑specific insights. Combining it with primary research—especially qualitative focus groups—ensures a more accurate market fit.
Adhere to the Information Technology Act 2000, obtain explicit consent for data collection, and stay updated on the Personal Data Protection Bill. For financial data, ensure compliance with RBI guidelines.
BizplanAI pro is tailored for the Indian market, offering AI‑driven analysis of local trends, competitor benchmarking, and price sensitivity modeling at an affordable Rs. 299 per analysis. Its pay‑as‑you‑go model makes it accessible for startups and mid‑size enterprises alike.
| Metric | Definition | Target Benchmark (India) |
|---|---|---|
| Market Share Growth | Percentage increase in sales relative to total market size. | 5‑10 % YoY for new entrants in FMCG; 15‑20 % for niche tech solutions. |
| Customer Acquisition Cost (CAC) | Total marketing spend divided by number of new customers. | Rs. 500‑1,000 for digital‑first brands in metros; Rs. 200‑500 in tier‑2. |
| Customer Lifetime Value (CLV) | Projected revenue from a customer over the entire relationship. | Rs. 5,000‑10,000 for subscription services; Rs. 2,000‑4,000 for consumables. |
| Brand Recall Score | Unaided recall percentage measured via surveys. | ≥ 30 % within 6 months of launch for mass‑market products. |
| Net Promoter Score (NPS) | Customer loyalty metric ranging from –100 to 100. | +30 or higher considered strong for Indian consumer brands. |
By following the structured approach outlined above, leveraging localized data sources, and integrating AI‑powered platforms like BizplanAI pro, Indian businesses can transform raw market information into strategic actions that drive sustainable growth.
It provides data‑driven insights on a 1.4 billion‑strong consumer base, helping firms tailor products, pricing, distribution and branding to a rapidly evolving market.
Research uncovers local preferences, unmet needs and cultural nuances, enabling businesses to design features, packaging and variants that resonate with Indian consumers.
Common methods include surveys (online & offline), focus groups, social media listening, mobile app analytics, and secondary data from government and industry reports.
They can use affordable platforms like Google Forms, WhatsApp polls, Instagram insights, and AI‑powered analytics tools to gather real‑time consumer feedback and trends.
It reveals price sensitivity, purchasing power and competitor benchmarks, allowing firms to set optimal price points that maximize volume and profit across diverse regions.