Launching a new product in India is a high‑stakes venture that can unlock access to a market of over 1.4 billion consumers. However, the sheer size and diversity of the Indian market also mean that a product that thrives in one region may flounder in another. Robust market research is the compass that guides businesses through this complex terrain, helping them to:
When market research is executed with precision, it reduces launch risk, accelerates time‑to‑market, and maximises ROI. Companies that invest in data‑driven insights are better positioned to capture market share before competitors can react.
India’s market presents a set of distinctive hurdles that demand a tailored research approach. Below is a snapshot of the most critical challenges.
| Challenge | Why It Matters for a Product Launch | Mitigation Strategy |
|---|---|---|
| Regional Diversity | Over 22 official languages and varied cultural norms affect product perception. | Segment research by state and language; use localized messaging. |
| Price Sensitivity | Average disposable income differs sharply between metros and Tier‑2/3 cities. | Conduct price elasticity studies; consider tiered pricing models. |
| Regulatory Landscape | Mandatory certifications (e.g., BIS, FSSAI) can delay launch timelines. | Map regulatory requirements early; engage compliance consultants. |
| Distribution Complexity | India’s supply chain involves modern trade, kirana stores, and e‑commerce. | Analyse channel preferences per product category and region. |
| Digital Penetration Gaps | Internet access is high in urban areas but limited in many rural pockets. | Blend offline and online research methods; leverage mobile surveys. |
Addressing these challenges with a data‑centric, locally adapted plan is not optional—it is the foundation of a successful product launch in India.
Choosing the right research methodology determines the depth and relevance of the insights you gather. Below is a comparative overview of the most effective approaches for the Indian context.
| Methodology | Application in India | Best Practices |
|---|---|---|
| Quantitative Surveys (Online & Mobile) | Ideal for large‑scale attitude and usage measurement across metros. | Use bilingual questionnaires; incentivise participation with mobile data vouchers. |
| Face‑to‑Face Interviews | Crucial for Tier‑2/3 towns where internet penetration is low. | Train local field agents; keep interviews under 20 minutes to respect time. |
| Focus Groups (Regional) | Uncover cultural nuances and product positioning insights. | Segment groups by language, age, and income; conduct sessions during non‑festival periods. |
| Social Listening & Sentiment Analysis | Track real‑time consumer chatter on platforms like WhatsApp, Instagram, and regional forums. | Deploy AI‑powered tools that understand Hindi, Tamil, Bengali, etc. |
| Test Marketing (Pilot Launch) | Validate demand in a controlled geography before a national rollout. | Select a mix of urban and semi‑urban cities; monitor sales, feedback, and supply chain performance. |
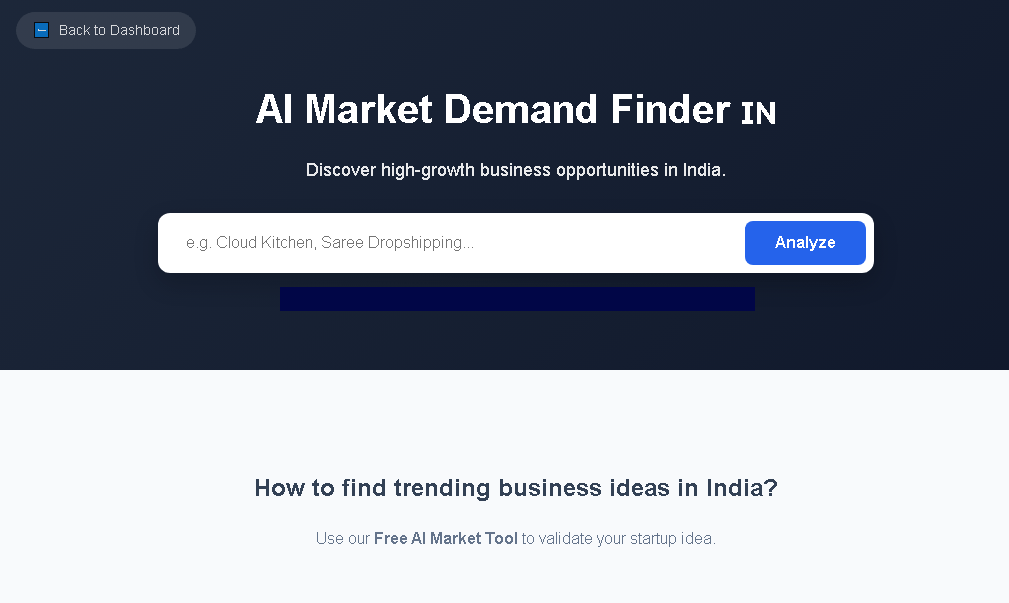
Among these, a hybrid model that blends quantitative breadth with qualitative depth yields the most actionable insights. For Indian businesses, integrating AI‑driven analytics—such as those offered by BizplanAI pro—can accelerate data processing and uncover hidden patterns across diverse datasets.
Access to reliable data and cutting‑edge tools is essential for turning raw information into strategic decisions. Below is a curated list of industry‑specific resources, many of which integrate seamlessly with BizplanAI pro.
| Resource / Tool | Type of Data Provided | How It Supports a Product Launch |
|---|---|---|
| BizplanAI pro Market Check | AI‑powered analysis of Indian market trends, competitor pricing, and consumer sentiment. | Instantly generates launch feasibility reports; pricing recommendations start at Rs. 299 (pay‑as‑you‑go). |
| CMIE Prowess Database | Macro‑economic indicators, industry‑level sales, and firm‑level financials. | Helps size market potential and benchmark against industry peers. |
| Statista India | Consumer behaviour statistics, e‑commerce penetration, and demographic breakdowns. | Provides macro trends to align product positioning. |
| Government of India – Ministry of Commerce & Industry | Regulatory guidelines, import‑export duties, and BIS certification requirements. | Ensures compliance planning is embedded early in the launch timeline. |
| Google Trends (India) | Search volume trends for keywords related to your product category. | Identifies seasonal spikes and regional interest clusters. |
| Social Listening Platforms (e.g., Brandwatch, Sprinklr) | Real‑time sentiment across social media, forums, and messaging apps. | Detects early consumer feedback and potential PR issues. |
Leveraging these tools in a coordinated research workflow reduces time‑to‑insight and equips teams with the evidence needed to make confident launch decisions.
Use demographic, psychographic, and behavioural criteria to segment the Indian market. Below is a typical segmentation matrix.
| Segment | Key Characteristics | Preferred Channels |
|---|---|---|
| Urban Millennials (25‑35) | High digital adoption, brand‑conscious, disposable income ≈ Rs 30‑50 k/month | E‑commerce, Instagram, OTT platforms |
| Tier‑2/3 Family Shoppers (30‑45) | Value‑seeking, family‑oriented, price‑sensitive | Kirana stores, regional TV, WhatsApp groups |
| Rural Aspirants (18‑30) | Emerging first‑time buyers, mobile‑first, aspirational | Feature phones, local fairs, community radio |
| Professional Executives (35‑50) | High purchasing power, premium‑brand preference | LinkedIn, premium retail outlets, private clubs |
For a confidence level of 95 % and a margin of error of ±3 %, a sample of roughly 1,000‑1,200 respondents across diverse regions provides statistically robust results. Adjust upwards if you need deeper segment‑level insights.
Budget allocations vary by industry, but a typical range is 5‑10 % of the projected first‑year revenue. Using cost‑effective AI tools like BizplanAI pro (starting at Rs 299 per analysis) can significantly reduce overall spend.
Only products that fall under the BIS mandatory certification list (e.g., electrical goods, certain toys, and safety equipment) require it. Check the BIS website early to avoid launch delays.
Social listening provides real‑time sentiment but lacks the structured, quantitative rigor of surveys. The best approach combines both: use listening to uncover themes and surveys to quantify them.
In fast‑moving consumer categories, quarterly refreshes are advisable. For durable goods, a semi‑annual review suffices. Continuous monitoring through platforms like BizplanAI pro ensures you stay ahead of competitor moves.
Measuring the impact of your research‑informed launch is crucial for learning and scaling. Below is a concise metric framework tailored for the Indian market.
| Metric | Definition | Target Benchmark (First 12 Months) |
|---|---|---|
| Market Share | Percentage of total category sales captured. | 5‑7 % in targeted segment. |
| Revenue per SKU | Average sales value per product unit. | Rs 1,200‑1,500 depending on price tier. |
| Customer Acquisition Cost (CAC) | Total marketing spend ÷ number of new customers. | Rs 250‑300 per customer (digital‑heavy campaigns). |
| Net Promoter Score (NPS) | Measure of brand advocacy. | +30 or higher. |
| Repeat Purchase Rate | Proportion of customers buying again within 6 months. | 40‑45 %. |
| Regulatory Compliance Timeline | Days taken from filing to approval. | ≤ 45 days for BIS‑certified goods. |
Regularly comparing actual performance against these benchmarks helps you fine‑tune distribution, pricing, and promotional tactics, ensuring sustained growth beyond the initial launch window.
It uncovers regional preferences, unmet needs, and competitive gaps, ensuring the product fits diverse consumer segments and reduces launch risk.
Demographics, purchasing power, cultural nuances, competitor pricing, distribution channels, and consumer pain points.
Analyze consumer surveys, social media sentiment, search trends, and gaps in existing product offerings across different states.
Combine quantitative surveys with qualitative focus groups, in‑field ethnographic studies, and secondary data from government and industry reports.
It reveals price sensitivity, preferred price points, and competitor pricing, allowing you to set a value‑based price that maximizes adoption and profit.