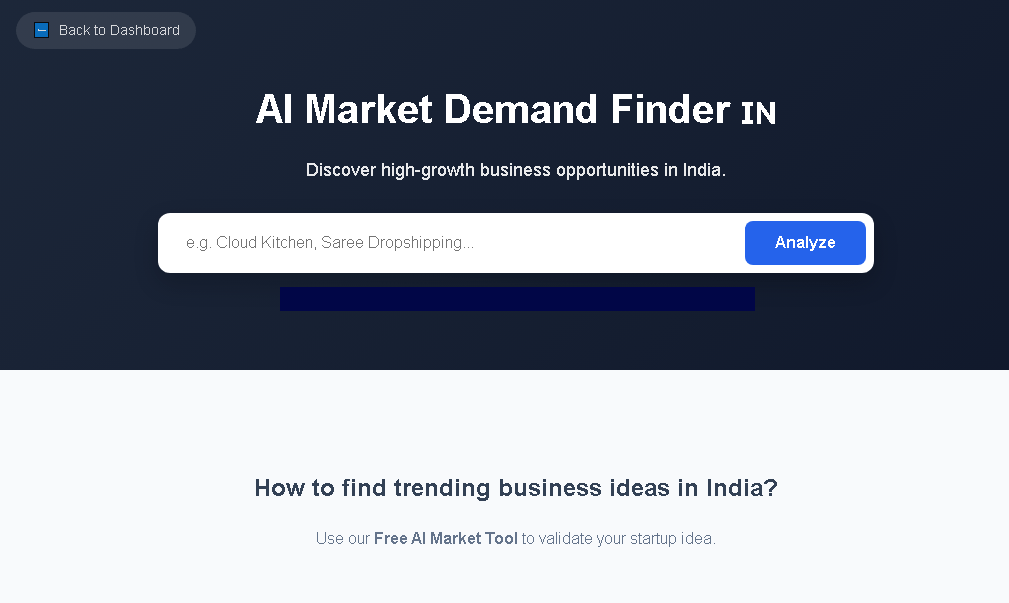
Launching a new business in India is both an exciting opportunity and a high‑stakes venture. With a consumer base of over 1.4 billion people, a rapidly digitising economy, and a diverse cultural landscape, the Indian market offers unparalleled growth potential. However, success is not guaranteed without a solid foundation of market research. Understanding local demand, pricing sensitivities, regulatory nuances, and competitive dynamics enables founders to make data‑driven decisions, allocate capital efficiently, and mitigate risks before they become costly setbacks.
Effective market research equips a new business with:
For entrepreneurs seeking an AI‑powered, India‑focused solution, BizplanAI pro offers real‑time analysis of market trends and competitor landscapes starting at just Rs. 299 per use, making sophisticated research accessible without a hefty consultancy budget.
India’s market is distinctively complex. The challenges listed below are specific to launching a new business and require a tailored research approach.
| Challenge | Why It Matters for New Business | Mitigation Strategy |
|---|---|---|
| Regional Diversity | Consumer preferences vary dramatically across states, languages, and income tiers. | Conduct segmented research at the state and city level; use multilingual surveys. |
| Regulatory Landscape | Frequent policy updates in sectors like fintech, e‑commerce, and healthcare can affect licensing. | Engage local legal advisors and monitor government portals. |
| Informal Economy | Large share of transactions occur offline or via cash, affecting data collection. | Blend primary field interviews with secondary digital data. |
| Price Sensitivity | Middle‑class consumers prioritize value for money, influencing product pricing. | Run price‑elasticity tests and benchmark against local competitors. |
| Infrastructure Gaps | Logistics and internet penetration differ between metros and tier‑2/3 cities. | Map supply‑chain capabilities and assess digital adoption rates. |
| Talent Acquisition | Skilled workforce concentrated in metros, while cost constraints push startups to smaller towns. | Analyze talent pools and salary benchmarks regionally. |
Choosing the right methodology determines the reliability of insights. Below are the most effective approaches for a new business operating in the Indian context.
| Methodology | Application in India | Best Practices |
|---|---|---|
| Quantitative Surveys (Online & Offline) | Reach urban millennials via mobile apps; reach rural households via face‑to‑face interviews. | Use stratified sampling, keep questionnaires under 10 minutes, translate into regional languages. |
| Focus Group Discussions (FGDs) | Gather cultural nuances and product perception in tier‑2/3 cities. | Facilitate with local moderators, provide incentives, record verbatim notes. |
| Social Listening & Sentiment Analysis | Leverage platforms like WhatsApp, Instagram, and regional forums (e.g., Koo, ShareChat). | Employ AI tools (e.g., BizplanAI pro) to filter Hindi, Tamil, Bengali keywords. |
| Competitive Benchmarking | Compare pricing, features, and distribution of domestic and multinational players. | Create a live dashboard updating quarterly; track new product launches. |
| Secondary Data Mining | Utilise government reports (Ministry of Statistics, RBI), industry whitepapers, and trade association data. | Validate with primary data; adjust for inflation and currency fluctuations. |
| Test Marketing & Pilot Launches | Deploy limited‑run products in select cities (e.g., Bengaluru, Jaipur) before scaling. | Measure conversion, repeat purchase, and Net Promoter Score (NPS). |
Access to reliable data is critical. The table below lists essential tools and resources that streamline research for a new business in India.
| Resource / Tool | Type | Key Features for Indian Market |
|---|---|---|
| BizplanAI pro | AI‑driven market intelligence platform | Real‑time Indian trend analysis, competitor mapping, price benchmarking; pay‑as‑you‑go from Rs. 299. |
| Statista India | Statistical database | Sector‑specific reports, CAGR forecasts, consumer spending patterns. |
| CMIE (Centre for Monitoring Indian Economy) | Economic data provider | State‑wise GDP, employment, and purchasing power indices. |
| Google Trends (India) | Search trend tool | Identify rising keywords across languages, seasonal spikes. |
| Social Media Listening Platforms (Brandwatch, Sprinklr) | Sentiment analysis | Support for Hindi, Marathi, Tamil, and regional vernaculars. |
| Government Portals (MCA, FSSAI, RBI) | Regulatory information | Company registration data, compliance checklists, licensing fees. |
| Industry Associations (FICCI, CII, NASSCOM) | Sector insights | Annual reports, policy briefs, networking events. |
| Survey Platforms (SurveyMonkey India, Kantar IMRB) | Primary data collection | Mobile‑optimised surveys, offline data capture, multilingual templates. |
Segment the Indian market using demographic, psychographic, and behavioural variables.
| Segment | Key Characteristics | Research Focus |
|---|---|---|
| Urban Millennials (18‑35) | High smartphone penetration, value‑conscious, brand‑aware. | Digital usage patterns, subscription willingness. |
| Tier‑2/3 Families | Price‑sensitive, community‑influenced, growing internet access. | Offline channel preferences, price elasticity. |
| Rural Entrepreneurs | Micro‑business owners, cash‑dominant, limited digital literacy. | Financing needs, product accessibility. |
| Corporate Procurement Teams | Decision‑makers in B2B, compliance‑driven. | Vendor evaluation criteria, contract terms. |
Match each segment to the most suitable research method (see “Key Methodologies & Approaches”).
Execute surveys, FGDs, and pilot launches. For nationwide coverage, partner with local field agencies to ensure data quality in remote regions.
Download latest reports from CMIE, Statista India, and industry bodies. Use BizplanAI pro to aggregate competitor pricing and trend data automatically.
Launch a Minimum Viable Product (MVP) in a controlled geography (e.g., Pune for urban, Jaipur for tier‑2). Track new business_success_metrics such as conversion rate, average order value, and churn.
Include executive summary, methodology, data visualisations, and actionable recommendations. Highlight how BizplanAI pro’s AI insights reduced research time by 40 %.
Incorporate feedback, refine pricing, and expand to additional states. Continuously monitor regulatory updates and consumer trend shifts using the AI platform.
Using AI‑enabled tools like BizplanAI pro, a startup can start with as little as Rs. 299 for a basic market snapshot. Comprehensive mixed‑method studies typically range from Rs. 50,000 to Rs. 2 lakh, depending on scope and geographic coverage.
A focused research project for a new business can be completed in 6‑8 weeks: 2 weeks for planning and instrument design, 3 weeks for data collection, and 2 weeks for analysis and reporting.
Not always. If your product targets a pan‑India audience, a stratified sample covering key regions (North, South, East, West, and Central) is sufficient. However, for region‑specific offerings—such as vernacular content or localised pricing—a state‑level deep dive is advisable.
Secondary data provides macro‑level insights but may miss granular consumer behaviours and emerging micro‑trends. Combining secondary sources with primary research ensures a more accurate picture, especially for a new business seeking product‑market fit.
BizplanAI pro scrapes Indian e‑commerce platforms, news portals, and regulatory filings to deliver real‑time competitor pricing, feature matrices, and market share estimates. This eliminates manual data collection and speeds up strategic decision‑making.
Key performance indicators for a new business include:
| Metric | Definition | Target for Early Stage |
|---|---|---|
| Customer Acquisition Cost (CAC) | Total marketing spend ÷ number of new customers. | Rs. 500 – Rs. 1,500 |
| Monthly Recurring Revenue (MRR) | Sum of subscription fees received each month. | Rs. 2 lakh within 3 months |
| Churn Rate | Percentage of customers who stop using the product each month. | < 5 % |
| Net Promoter Score (NPS) | Customer loyalty gauge ranging from –100 to +100. | +30 or higher |
| Average Order Value (AOV) | Total revenue ÷ number of orders. | Rs. 800 – Rs. 1,200 |
Monitoring these metrics against the baseline established during research helps you pivot quickly and sustain growth.
It reveals consumer demand, pricing sensitivity, competition, and regulatory nuances, helping you craft a viable strategy and reduce failure risk.
Define your target segment, gather secondary data on industry trends, then conduct primary surveys or interviews to validate assumptions.
Use price‑elasticity surveys, A/B testing, and competitor price benchmarking to gauge how price changes affect demand.
Identify sector‑specific licenses, tax structures (GST), foreign investment rules, and local labor laws that could impact operations.
Online survey platforms (Google Forms, SurveyMonkey), social listening tools, mobile app analytics, and field interviews in key regions.