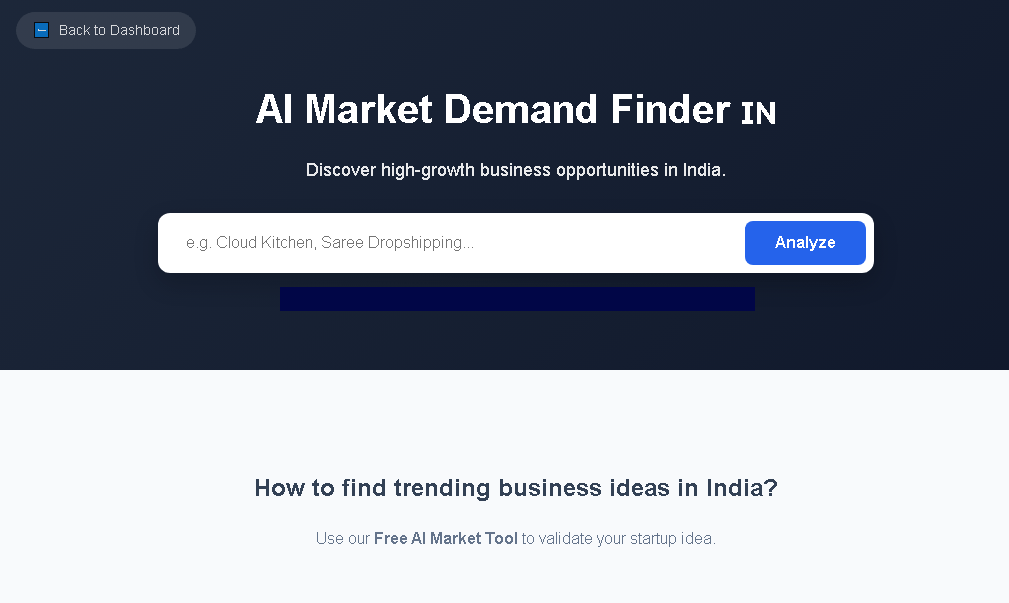
India’s small business ecosystem is the backbone of the nation’s economy, contributing over 30% to the GDP and employing more than 110 million people. However, the sheer diversity of regional preferences, price sensitivities, and regulatory nuances makes it essential for any small business to base decisions on solid market research. Conducting systematic research helps entrepreneurs understand consumer behaviour, identify untapped niches, and mitigate risks before committing precious capital.
In a market where a single rupee can determine profitability, leveraging data‑driven insights is no longer optional—it’s a competitive necessity. Whether you are launching a boutique apparel store in Delhi, a street‑food stall in Kolkata, or a tech‑enabled service in Bengaluru, a well‑structured market research plan equips you with the intelligence needed to craft offers that resonate with Indian consumers.
Small businesses in India face a distinctive set of hurdles that differentiate them from larger enterprises. Understanding these challenges is the first step toward designing a tailored research approach.
| Challenge | Why It Matters for a Small Business | Implication for Research |
|---|---|---|
| Limited Financial Resources | Cash flow constraints limit marketing spend and inventory buffers. | Research must prioritize cost‑effective tools and focus on high‑ROI insights. |
| Regulatory Compliance (MSME Registration, GST) | Non‑compliance can result in fines or loss of eligibility for government schemes. | Include regulatory landscape analysis in the research scope. |
| Fragmented Consumer Base | India’s cultural, linguistic, and economic diversity creates varied buying patterns. | Segmented audience research is crucial to avoid one‑size‑fits‑all strategies. |
| Digital Adoption Gap | While urban areas are highly connected, many Tier‑2/3 towns still rely on offline channels. | Blend online surveys with offline focus groups to capture the full picture. |
| Intense Local Competition | Informal vendors and established regional brands often dominate shelf space. | Competitive benchmarking must include both formal and informal players. |
Because these challenges are interlinked, a one‑dimensional research method rarely suffices. A blended approach that balances depth, affordability, and local relevance is essential for success.
Below are the most effective research methodologies for Indian small businesses, each explained with its relevance, application steps, and best‑practice tips.
| Methodology | Relevance to Indian Small Business | Best‑Practice Tips |
|---|---|---|
| Primary Surveys (Online & Offline) | Direct feedback on price sensitivity, product features, and brand perception. | Use short questionnaires (5‑7 questions), offer a small incentive (e.g., Rs. 50 voucher), and translate into regional languages. |
| Focus Group Discussions (FGDs) | Rich qualitative insights into cultural nuances and buying triggers. | Recruit participants representing each target segment; conduct sessions in local dialects. |
| Observational Store Audits | Helps map footfall, shelf placement effectiveness, and competitor pricing. | Visit at peak and off‑peak hours; use a simple checklist to capture data consistently. |
| Social Listening & Sentiment Analysis | Captures real‑time consumer conversations on platforms like WhatsApp, Instagram, and regional forums. | Leverage AI‑driven tools (e.g., BizplanAI pro) to filter noise and focus on relevant keywords. |
| Secondary Data Review | Utilizes existing reports from government bodies, industry associations, and market research firms. | Cross‑verify data with primary findings to ensure reliability. |
Choosing the right toolkit can dramatically reduce research costs while enhancing accuracy. Below is a curated list of platforms, databases, and government resources that are especially valuable for Indian small businesses.
| Resource / Tool | What It Offers | Cost (INR) |
|---|---|---|
| BizplanAI pro – Market Check | AI‑powered analysis of Indian market trends, competitor mapping, and consumer sentiment. | Starts at Rs. 299 (pay‑as‑you‑go) |
| Ministry of MSME Portal | Guidelines on registration, subsidies, and compliance requirements. | Free |
| GSTN (Goods & Services Tax Network) | Real‑time tax data, filing status, and compliance alerts. | Free |
| Statista India | Industry‑specific reports, market size, and growth forecasts. | Subscription – approx. Rs. 5,000/month |
| Google Trends (India) | Search interest over time, regional popularity, and related queries. | Free |
| Local Chambers of Commerce (e.g., FICCI, CII) | Networking events, market intelligence newsletters, and policy updates. | Membership varies (Rs. 2,000‑10,000 annually) |
Among these, BizplanAI pro stands out as a cost‑effective, AI‑driven solution that aligns perfectly with the budget constraints of a small business. Its pay‑as‑you‑go pricing model ensures you only pay for the insights you need, making it ideal for iterative research cycles.
Follow this actionable roadmap to move from concept to data‑driven decision making.
Use demographic, psychographic, and behavioural criteria to create detailed personas.
| Segment | Key Characteristics | Preferred Channels |
|---|---|---|
| Urban Young Professionals (25‑35) | Tech‑savvy, disposable income, brand‑conscious. | Instagram, LinkedIn, Mobile Apps |
| Tier‑2 Family Shoppers (30‑45) | Value‑seeking, price‑sensitive, family‑oriented. | WhatsApp groups, Local FM, In‑store |
| Rural Micro‑Entrepreneurs (35‑55) | Entrepreneurial, cash‑based, community driven. | Village fairs, Community radio, Word‑of‑mouth |
Combine primary surveys (online via Google Forms, offline via paper questionnaires) with secondary data review. For AI‑enhanced insights, run the data through BizplanAI pro.
Track the metrics listed in the table below for at least three months post‑launch.
| Success Metric | Definition | Target for First 6 Months |
|---|---|---|
| Customer Acquisition Cost (CAC) | Total marketing spend ÷ number of new customers. | ≤ Rs. 500 per customer |
| Repeat Purchase Rate | Percentage of customers who buy again within 30 days. | ≥ 30% |
| Market Share in Target Segment | Share of sales within defined segment compared to competitors. | 5% in Tier‑2 cities |
| Net Promoter Score (NPS) | Customer willingness to recommend (scale –100 to +100). | +25 or higher |
Every quarter, revisit the research framework, refresh data sources, and adjust tactics accordingly.
With cost‑effective tools like BizplanAI pro (starting at Rs. 299 per analysis) and free government data, a basic research cycle can be completed for under Rs. 10,000, excluding incentives for respondents.
Registration is not mandatory for research, but it unlocks subsidies and grants that can offset research expenses.
No. While online surveys capture the urban segment efficiently, Tier‑2 and Tier‑3 markets still depend heavily on offline interactions. A hybrid approach ensures representativeness.
Given the rapid evolution of consumer preferences in India, a quarterly review is advisable for high‑growth sectors (e‑commerce, FMCG). For slower‑moving industries, bi‑annual updates may suffice.
Comply with the Information Technology (Reasonable Security Practices and Procedures) Rules, 2011, and obtain explicit consent before storing personal data. Ensure GDPR‑like privacy statements if you plan to handle data of NRIs.
BizplanAI pro uses AI to scan thousands of Indian market reports, social media chatter, and competitor pricing in real time. It delivers concise dashboards that highlight emerging trends, allowing a small business to pivot quickly without hiring a full‑time analyst.
It reveals local consumer preferences, price sensitivity, and regulatory nuances, enabling data‑driven decisions that boost competitiveness and reduce risk.
Online surveys, social media listening, competitor analysis, and informal focus groups with existing customers are low‑budget yet insightful techniques.
Segment the market by geography, language, income, and buying behavior, then validate segments through quick polls or pilot sales.
Compliance with GST, local licensing, labor laws, and any sector‑specific regulations must be factored into product pricing and distribution strategies.
Conduct a baseline study before launch, then review key metrics quarterly to capture shifts in consumer trends and competitive dynamics.