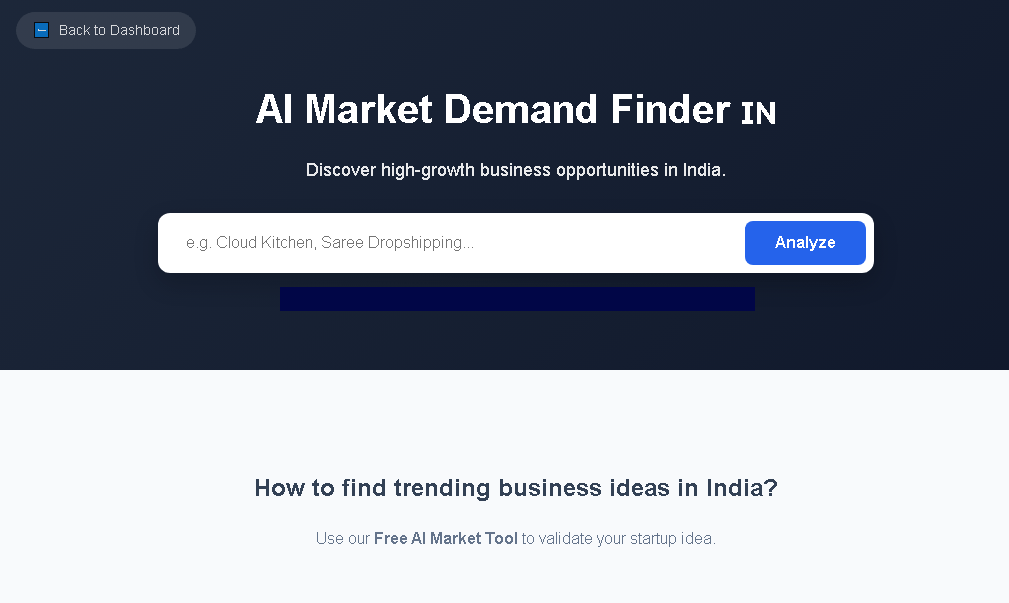
In a country as diverse and rapidly evolving as India, launching or expanding a product without thorough market research is akin to navigating a bustling metropolis blindfolded. From the multilingual consumer base to region‑specific purchasing power, the Indian market presents a unique tapestry of opportunities and obstacles. Conducting robust market research equips businesses with data‑driven insights that reduce risk, sharpen positioning, and accelerate growth. Moreover, with the rise of digital commerce, AI‑powered analytics, and a young, tech‑savvy demographic, the stakes—and the rewards—have never been higher.
For entrepreneurs and established firms alike, the ability to understand local trends, regulatory nuances, and consumer behavior is the cornerstone of a successful product strategy. This article delves deep into the specific challenges of researching a product in India, outlines proven methodologies, highlights essential tools—including the AI‑driven platform BizplanAI pro—and provides a step‑by‑step roadmap to turn raw data into actionable business decisions.
| Challenge | Impact on Product Strategy | Mitigation Tactics |
|---|---|---|
| Regional Language Diversity | Messaging may not resonate uniformly across states. | Localize content; conduct focus groups in key languages. |
| Price Sensitivity | High price points can limit adoption, especially in tier‑2/3 cities. | Tiered pricing models; leverage pay‑as‑you‑go plans like BizplanAI pro starting at Rs. 299/‑. |
| Regulatory Compliance (e.g., GST, BIS standards) | Non‑compliance can lead to fines or market bans. | Engage legal counsel early; embed compliance checks in research. |
| Infrastructure Variability | Logistics and digital connectivity differ vastly between metros and rural areas. | Map supply‑chain capabilities; test digital adoption rates. |
| Consumer Trust & Brand Loyalty | New entrants face skepticism, especially for high‑involvement products. | Leverage testimonials; partner with local influencers. |
| Segment | Key Demographics | Buying Triggers |
|---|---|---|
| Urban Millennials (25‑35) | College‑educated, INR 30‑70 k/month, metro residents. | Tech integration, social proof, sustainability. |
| Tier‑2/3 Family Shoppers (30‑45) | Middle‑income, family‑oriented, Hindi‑speaking. | Value for money, durability, local availability. |
| Rural Early Adopters (18‑30) | Agricultural workers, smartphone users, regional language. | Affordability, ease of use, government subsidies. |
| Corporate Procurement (B2B) | SME owners, procurement managers, INR 5‑50 Cr turnover. | ROI, compliance, after‑sales service. |
| Methodology | When to Use | Best Practices |
|---|---|---|
| Quantitative Surveys (online & offline) | When you need statistically significant data on price elasticity, brand awareness, or feature preference. | Use stratified sampling across states; keep questionnaires under 10 minutes; incentivize respondents. |
| Qualitative Focus Groups | Exploring cultural nuances, emotional drivers, and product perception. | Conduct separate groups per language; employ neutral moderators; record and transcribe for thematic analysis. |
| Competitive Benchmarking | Assessing where your product stands against existing players. | Map features, pricing, distribution, and digital presence; use tools like BizplanAI pro for AI‑driven competitor scoring. |
| Social Listening & Sentiment Analysis | Real‑time perception monitoring on platforms such as Twitter, Instagram, and regional forums. | Set up keyword clusters in Hindi, Tamil, Bengali, etc.; apply sentiment thresholds; cross‑validate with survey data. |
| Field Trials & Pilots | Testing product performance in a controlled geographic slice before full rollout. | Select 3‑5 diverse districts; track adoption, repeat purchase, and NPS; iterate based on feedback. |
| Metric | Definition | Target Benchmark (India) |
|---|---|---|
| Customer Acquisition Cost (CAC) | Total spend to acquire one paying customer. | Rs. 500‑1,200 for consumer products; Rs. 2,000‑5,000 for B2B. |
| Net Promoter Score (NPS) | Likelihood of customers recommending the product. | +30 for consumer goods; +20 for niche industrial products. |
| Market Share Growth (Quarterly) | Percentage increase in product’s share within its category. | 3‑5 % YoY in fast‑moving consumer segments. |
| Retention Rate (6‑Month) | Proportion of customers still active after six months. | 70 % for subscription‑based models; 55 % for one‑off purchases. |
| Price Elasticity Index | Change in demand relative to price adjustments. | -1.2 to -1.8 for price‑sensitive categories. |
| Tool / Resource | Primary Use | Cost (INR) |
|---|---|---|
| BizplanAI pro – Market Check | AI‑driven competitor analysis, trend forecasting, and market sizing. | Starting at Rs. 299/‑ (pay‑as‑you‑go) |
| CMIE Prowess | Macro‑economic data, industry reports, and state‑level indicators. | Subscription from Rs. 12,000/‑ per year |
| Statista India | Statistical snapshots, consumer behavior studies. | Rs. 8,000/‑ per month |
| Google Trends & Keyword Planner | Search interest, seasonal spikes, and keyword volume. | Free (with Google Ads account) |
| Social Listening Platforms (e.g., Brandwatch, Sprinklr) | Real‑time sentiment, hashtag tracking, influencer mapping. | Rs. 15,000‑30,000/‑ per month |
| Government Portals (Ministry of Commerce, FSSAI, BIS) | Regulatory guidelines, certification requirements. | Free |
It provides data‑driven insights on diverse consumer preferences, regional purchasing power, and competitive landscape, reducing risk and guiding effective product positioning.
Demographic analysis, cultural and linguistic segmentation, buying behavior studies, price sensitivity testing, and competitor benchmarking.
Combine quantitative surveys in multiple local languages with qualitative focus groups, leveraging online panels and regional field agents for broader reach.
Regional heterogeneity, varying internet penetration, differing regulatory norms across states, and rapidly changing consumer trends driven by urbanization.
It identifies price elasticity across income groups and regions, enabling tiered pricing or localized offers that align with consumers' purchasing power.