India’s business landscape is evolving at break‑neck speed, driven by digital adoption, a youthful consumer base, and a surge in entrepreneurial activity. Conducting rigorous market research is no longer a nice‑to‑have—it’s a strategic imperative for any businesses looking to launch, scale, or pivot in this dynamic environment. Accurate research helps you uncover unmet needs, anticipate regulatory shifts, and benchmark against local competitors, ultimately reducing risk and accelerating growth.
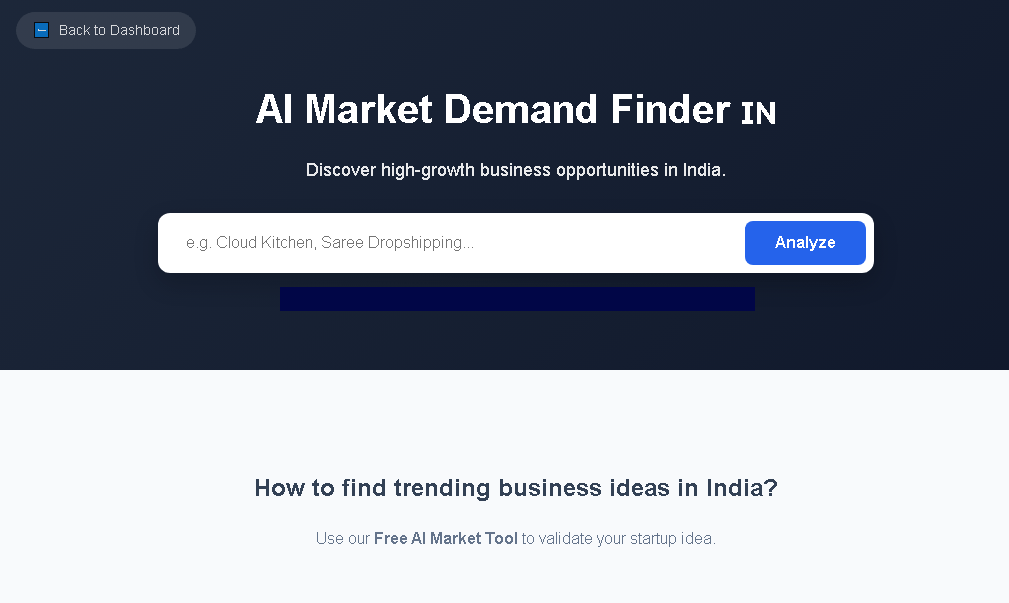
When you blend traditional research techniques with AI‑powered analytics, you gain a 360° view of market dynamics. Tools like BizplanAI pro enable Indian businesses to analyze trends, monitor competitor activity, and generate data‑driven insights for as little as Rs. 299/- on a pay‑as‑you‑go basis, making high‑quality research accessible to startups and SMEs alike.
India’s regulatory framework varies across states and sectors. From GST compliance to sector‑specific licenses (e.g., FSSAI for food, RBI guidelines for fintech), businesses must navigate a maze of rules that can affect product pricing, distribution, and marketing.
The Indian market is fragmented by language, culture, income levels, and urban‑rural divide. A one‑size‑fits‑all approach fails; you need hyper‑local insights to tailor messaging, pricing, and channel strategies.
Logistics, internet penetration, and payment infrastructure differ markedly between metros and tier‑2/3 cities. Market research must factor in these constraints to forecast realistic adoption rates.
Both global giants and home‑grown startups compete fiercely across categories. Understanding competitor positioning, pricing tactics, and innovation pipelines is critical for differentiation.
| Business‑Specific Challenges | Description & Impact on Strategy |
|---|---|
| Regulatory Variability | State‑level tax rates, licensing requirements, and compliance timelines can delay product launches and increase operating costs. |
| Cultural & Linguistic Diversity | Marketing messages must be localized; a campaign successful in Hindi‑speaking regions may flop in Tamil Nadu. |
| Infrastructure Gaps | Limited broadband in rural areas affects e‑commerce penetration; logistics bottlenecks raise delivery costs. |
| Price Sensitivity | Indian consumers often prioritize value for money, requiring precise pricing strategies based on disposable income data. |
| Rapid Technological Adoption | High mobile usage and AI adoption demand omnichannel experiences and real‑time data analytics. |
Given the high smartphone penetration (over 750 million users), deploying short, mobile‑optimized surveys via WhatsApp, SMS, or app push notifications yields higher response rates.
In‑store observations, home visits, and focus groups uncover hidden cultural nuances—especially important for FMCG, apparel, and health‑care sectors.
Leverage data from the Ministry of Statistics and Programme Implementation (MOSPI), RBI, and India Stat for macro‑economic trends, demographic breakdowns, and sector‑level growth rates.
Platforms like BizplanAI pro scrape regional social media (Twitter, Instagram, regional forums) to gauge real‑time consumer sentiment and emerging trends.
Apply the Herfindahl‑Hirschman Index (HHI) to assess market concentration and identify white‑space opportunities.
| Recommended Methodology | Why It’s Relevant in India | Best Practice Tips |
|---|---|---|
| Mobile‑First Surveys | Captures the large mobile‑only user base across urban and rural segments. | Keep questionnaires under 10 questions; use local language options. |
| Ethnographic Studies | Reveals cultural rituals influencing purchase decisions (e.g., festival buying). | Engage local moderators; conduct sessions in native languages. |
| Secondary Data Mining | Provides cost‑effective macro insights and validates primary findings. | Cross‑verify data from multiple government sources for accuracy. |
| AI‑Driven Sentiment Analysis | Real‑time pulse on consumer mood, especially on regional platforms like ShareChat. | Train models on multilingual datasets; filter out bot noise. |
| Competitive Benchmarking | Quantifies market concentration and highlights under‑served niches. | Update HHI calculations quarterly to capture fast‑moving market shifts. |
Access to reliable data and analytical tools is the backbone of any research initiative. Below is a curated list of Indian‑centric resources that complement AI solutions like BizplanAI pro.
| Industry Resource / Tool | Description | Link / Access |
|---|---|---|
| BizplanAI pro | AI‑powered market‑trend analysis, competitor monitoring, and demand forecasting tailored for Indian markets. | https://bizplanaipro.in/market-check/ |
| CMIE Prowess | Comprehensive database of Indian company financials, industry reports, and macro‑economic indicators. | CMIE |
| IndiaStat | Statistical repository covering demographics, consumer expenditure, and sectoral growth. | IndiaStat |
| RBI Economic Data | Official data on inflation, interest rates, and credit flows crucial for financial services research. | RBI |
| Google Trends (India) | Real‑time search interest data, useful for spotting emerging product categories. | Google Trends |
| Social Media Listening Platforms (e.g., Brandwatch, Sprinklr) | Capture regional conversations across Hindi, Bengali, Tamil, and other languages. | Vendor sites (subscription based) |
Use demographic, psychographic, and behavioural data to create granular segments. In India, common segmentation axes include:
Combine quantitative (surveys, online polls) with qualitative (focus groups, in‑home interviews) approaches. Leverage AI tools like BizplanAI pro for rapid sentiment analysis and predictive modeling.
Deploy field teams for ethnographic studies in high‑touch categories (e.g., FMCG). Simultaneously run digital surveys via WhatsApp, email, and app push notifications.
Use BizplanAI pro to generate predictive demand curves, cluster analysis, and competitor heat‑maps. Supplement with Excel or SPSS for regression analysis where needed.
Prepare a concise slide deck with visualizations (charts, heat‑maps) and an executive summary. Highlight ROI projections and risk mitigation strategies.
Set up ongoing dashboards (e.g., via BizplanAI pro) to track success metrics in real time and adjust tactics as market conditions evolve.
| Success Metric | Definition | How to Measure |
|---|---|---|
| Market Share Growth | Increase in the percentage of total category sales captured. | Compare pre‑ and post‑research sales data; use industry reports for benchmark. |
| Customer Acquisition Cost (CAC) Reduction | Lower cost to acquire a new customer after applying research‑driven targeting. | Track marketing spend vs. number of new customers over a defined period. |
| Product‑Market Fit Score | Composite score based on satisfaction, repeat purchase intent, and NPS. | Conduct post‑launch surveys and calculate Net Promoter Score (NPS). |
| Time‑to‑Market (TTM) | Duration from concept ideation to product launch. | Log project milestones; compare against industry average (typically 6‑12 months in India). |
| Regulatory Compliance Rate | Percentage of required licenses, certifications, and filings completed on schedule. | Audit compliance checklist; aim for ≥ 95 % adherence. |
| ROI of Research Investment | Financial return generated per rupee spent on market research. | (Incremental profit attributable to research ÷ Research spend) × 100. |
Spending varies by industry, but a common benchmark is 2‑5 % of projected annual revenue. With AI‑driven platforms like BizplanAI pro starting at Rs. 299/‑ per analysis, even micro‑budget startups can afford high‑quality insights.
Secondary data provides macro‑level context, but primary research uncovers local nuances, unmet needs, and real‑time sentiment—critical in a culturally diverse market like India.
In fast‑moving sectors (e‑commerce, fintech), quarterly updates are advisable. For slower‑changing industries (industrial equipment), semi‑annual or annual refreshes may suffice.
Yes. Conjoint analysis, price elasticity studies, and competitor price monitoring (available via BizplanAI pro) enable you to set optimal price points that balance value perception with profitability.
AI accelerates data processing, enables multilingual sentiment analysis, predicts demand trends, and automates competitor benchmarking—making research faster, cheaper, and more actionable.
Yes. The Information Technology (Reasonable Security Practices and Procedures and Sensitive Personal Data or Information) Rules 2021 require explicit consent, data minimisation, and secure storage. Ensure all surveys and digital touchpoints comply with these regulations.
It provides data‑driven insights on consumer behavior, competitive dynamics, and regulatory trends, enabling informed decisions and reducing market entry risk.
By combining surveys, social listening, and analysis of purchase patterns to spot gaps between current offerings and customer expectations.
Compliance with GST, FDI norms, labor laws, data protection (PDPA) and sector‑specific licenses is critical to avoid legal setbacks.
Platforms like Google Trends, Kantar, SurveyMonkey, and AI‑powered analytics tools such as Crayon or SEMrush help gather and interpret real‑time market data.
At least annually, or whenever there are major shifts in consumer trends, technology, or regulatory policies to stay competitive.