India’s ecommerce landscape has transformed from a niche online‑shopping channel to a $120 billion industry that is projected to cross $200 billion by 2028. This rapid expansion is driven by widespread smartphone adoption, affordable data plans, and a growing middle‑class with disposable income. However, the sheer size and diversity of the Indian market mean that a one‑size‑fits‑all strategy rarely succeeds.
Conducting rigorous market research is the cornerstone of any successful ecommerce venture in India. It equips founders, product managers, and marketers with actionable insights on consumer behaviour, regional preferences, pricing elasticity, and competitive dynamics. When research is grounded in local data, businesses can:
In short, market research turns uncertainty into a strategic advantage, enabling ecommerce brands to capture market share faster and sustain long‑term profitability.
India’s ecommerce sector presents a distinct set of obstacles that differ markedly from Western or other Asian markets. Understanding these challenges is essential before designing a research framework.
| Challenge | Description | Impact on Research Design |
|---|---|---|
| Regional Language Diversity | More than 22 official languages; many consumers prefer vernacular interfaces. | Surveys and focus groups must be conducted in multiple languages; translation accuracy is critical. |
| Logistics & Last‑Mile Delivery | Infrastructure gaps in Tier‑2/3 cities and rural areas. | Include logistics feasibility studies and partner capability assessments. |
| Cash‑on‑Delivery (CoD) Preference | Approximately 70 % of online transactions still use CoD. | Research payment‑method adoption trends and risk‑mitigation strategies. |
| Regulatory Compliance | GST filing, FDI limits, and data‑privacy (IT Act 2021) obligations. | Incorporate legal‑risk analysis into competitive benchmarking. |
| Price Sensitivity | Consumers often compare prices across multiple platforms before purchase. | Price‑elasticity testing and dynamic‑pricing models become essential. |
| Fragmented Consumer Segments | Wide variance in purchasing power, internet penetration, and cultural preferences. | Segment‑specific personas must be built using both quantitative and qualitative data. |
To address the above challenges, a blend of quantitative and qualitative methods is recommended. The table below outlines the most effective methodologies for Indian ecommerce research, their typical applications, and best‑practice tips.
| Methodology | When to Use It | Best Practices for India |
|---|---|---|
| Online Surveys (Mobile‑First) | Large‑scale consumer preference and intent measurement. | Deploy on WhatsApp, Instagram, and regional apps; keep questionnaires under 10 minutes; offer tiered incentives. |
| In‑Depth Interviews (IDIs) | Understanding motivations behind high‑value purchases or churn. | Hire interviewers fluent in local dialects; conduct in participants’ homes or via video call to capture context. |
| Focus Groups (Hybrid) | Testing new UI/UX concepts, packaging, or promotional messages. | Mix urban and semi‑urban participants; use visual aids and live product demos. |
| Social Listening & Sentiment Analysis | Tracking brand perception and emerging trends on platforms like Twitter, Facebook, and regional forums. | Utilise NLP models trained on Hindi, Tamil, Bengali, etc., to capture vernacular sentiment. |
| Competitive Benchmarking | Assessing pricing, assortment, and service levels of rivals. | Combine scraper tools with manual verification; factor in regional promotions. |
| Purchase Funnel Analytics | Identifying drop‑off points in the checkout process. | Integrate with Google Analytics 4 and server‑side tracking to capture CoD abandonment. |
| Field Experiments (A/B Testing) | Validating hypotheses on discounts, delivery windows, or loyalty schemes. | Run tests across multiple states to account for cultural variance. |
Reliable data is the lifeblood of any research effort. Below is a curated list of Indian‑specific resources, platforms, and tools that provide up‑to‑date market intelligence, consumer behaviour metrics, and competitive insights.
| Resource / Tool | Primary Use | Cost (Approx.) |
|---|---|---|
| BizplanAI Pro – Market Check | AI‑driven analysis of Indian ecommerce trends, competitor pricing, and consumer sentiment. | Starts at Rs. 299 / pay‑as‑you‑go |
| Statista – India Ecommerce | Macro‑level market size, growth forecasts, and sector breakdowns. | Subscription ≈ Rs. 5,000 / month |
| CRIF High Mark – Retail & Consumer Survey | Quarterly consumer confidence and purchase intention data. | Report ≈ Rs. 12,000 / download |
| Data Labs – GST Transaction Database | Real‑time sales volumes by product category and state. | Custom pricing (usually Rs. 20,000 +) |
| Google Trends India | Search‑interest heatmaps for product categories and seasonal spikes. | Free |
| App Annie (now data.ai) – App Usage | Insights into mobile commerce app downloads and engagement. | Free tier; premium ≈ Rs. 8,000 / month |
| Amazon Seller Central – Category Reports | Marketplace‑level sales velocity, price ranges, and review analytics. | Free for registered sellers |
| Flipkart Seller Hub – Insights Dashboard | Similar to Amazon, focused on Indian consumer behaviour. | Free for registered sellers |
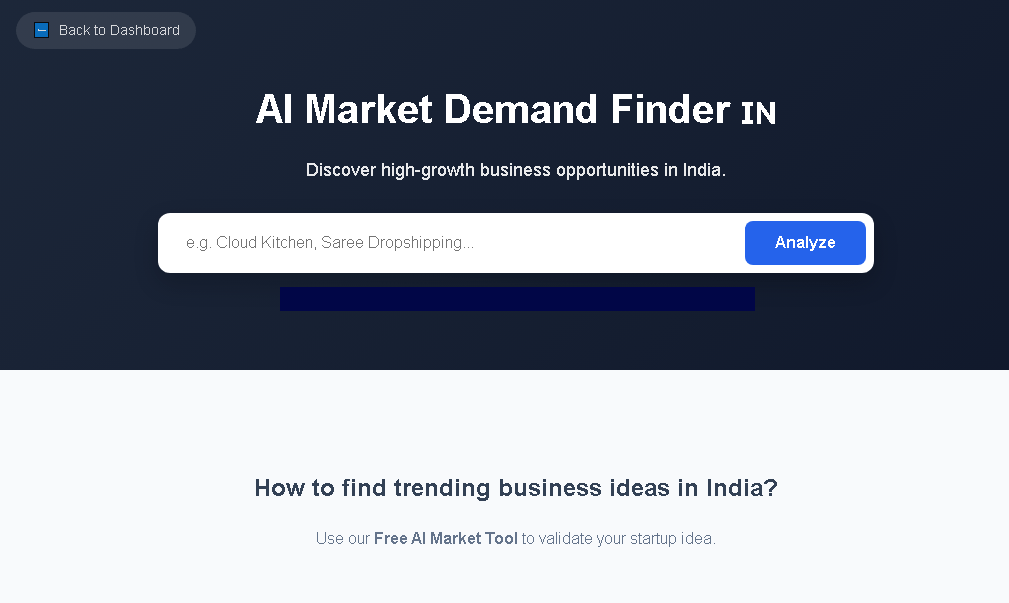
Among these, BizplanAI Pro stands out as the most cost‑effective, AI‑powered solution for startups and mid‑size players. It automatically aggregates data from the sources above, applies predictive modelling, and delivers ready‑to‑use dashboards that highlight growth opportunities, pricing gaps, and competitor moves—all for as low as Rs. 299 per query.
Use demographic, psychographic, and behavioural variables to create distinct segments. The table below illustrates common Indian ecommerce audience clusters.
| Segment | Key Characteristics | Preferred Channels |
|---|---|---|
| Urban Millennials (25‑35) | High disposable income, tech‑savvy, brand‑aware. | Instagram, YouTube, Mobile Apps |
| Tier‑2/3 Value Shoppers (30‑45) | Price‑sensitive, prefer CoD, rely on regional language sites. | WhatsApp, Facebook Marketplace, Regional e‑commerce portals |
| Rural Aspirational Buyers (18‑30) | Limited internet bandwidth, mobile‑first, trust community reviews. | SMS offers, regional OTT platforms, Voice‑based assistants |
| Senior Professionals (35‑55) | Focus on quality, willing to pay premium, use credit cards. | LinkedIn, Email newsletters, Desktop sites |
Refer to the “Key Methodologies & Approaches” table for guidance. For example, a price‑elasticity study may combine online surveys with field experiments across selected cities.
Set up continuous tracking using Google Analytics 4, Mixpanel, or the real‑time monitoring module in BizplanAI. Re‑run key surveys quarterly to capture shifting consumer sentiment.
| Metric | Definition | Target Benchmark (Indian ecommerce) |
|---|---|---|
| Conversion Rate (CR) | Percentage of site visitors who complete a purchase. | 3 % – 5 % (higher for niche categories) |
| Average Order Value (AOV) | Mean monetary value of each transaction. | Rs. 1,200 – Rs. 2,500 depending on segment |
| Cart Abandonment Rate | Share of initiated checkouts that are not completed. | Below 70 % (CoD‑heavy markets) |
| Customer Acquisition Cost (CAC) | Total marketing spend divided by new customers acquired. | Rs. 150 – Rs. 300 per user |
| Repeat Purchase Rate (RPR) | Proportion of customers making a second purchase within 90 days. | 20 % – 30 % |
| Net Promoter Score (NPS) | Measure of customer advocacy on a –100 to +100 scale. | +30 or higher for premium segments |
Leverage the pay‑as‑you‑go model of BizplanAI Pro. Its AI engine can simulate price‑elasticity scenarios using historical transaction data from GST filings and marketplace APIs, reducing the need for expensive large‑scale surveys.
Given the fast‑changing Indian consumer landscape, a quarterly refresh is advisable for macro trends (pricing, demand spikes) and a semi‑annual deep dive for segment‑specific behaviours.
Yes. The Indian IT Act 2021 mandates explicit consent for personal data collection, secure storage, and the right to delete upon request. Ensure your survey platform includes a consent checkbox and follows encryption standards.
Based on recent BizplanAI analytics, Maharashtra, Karnataka, Tamil Nadu, and Delhi‑NCR lead in total sales, while emerging growth hotspots include West Bengal, Uttar Pradesh, and Gujarat for Tier‑2 city penetration.
Secondary data provides a solid macro view but lacks granularity on regional consumer preferences, payment‑method nuances, and brand‑specific perception. Combine secondary reports with primary research (surveys, IDIs) for a complete picture.
Track post‑research KPIs such as lift in conversion rate, reduction in CAC, and increase in repeat purchase rate. Compare these improvements against the total cost of research (including tool subscriptions like BizplanAI Pro) to calculate a clear ROI percentage.
India's ecommerce market is valued at about $120 billion and is expected to exceed $200 billion by 2028.
Research uncovers regional preferences, price sensitivity, and platform usage, helping brands tailor strategies to a highly diverse consumer base.
Widespread smartphone adoption, cheap data plans, and an expanding middle class with disposable income are the main drivers.
No; India's cultural, linguistic, and economic diversity requires localized approaches for product selection, pricing, and marketing.
Challenges include intense competition, logistics across varied geographies, regulatory compliance, and the need for localized payment solutions.